Synthetic control with sci-kit learn models#
from sklearn.linear_model import LinearRegression

import causalpy as cp
Load data#
df = cp.load_data("sc")
treatment_time = 70
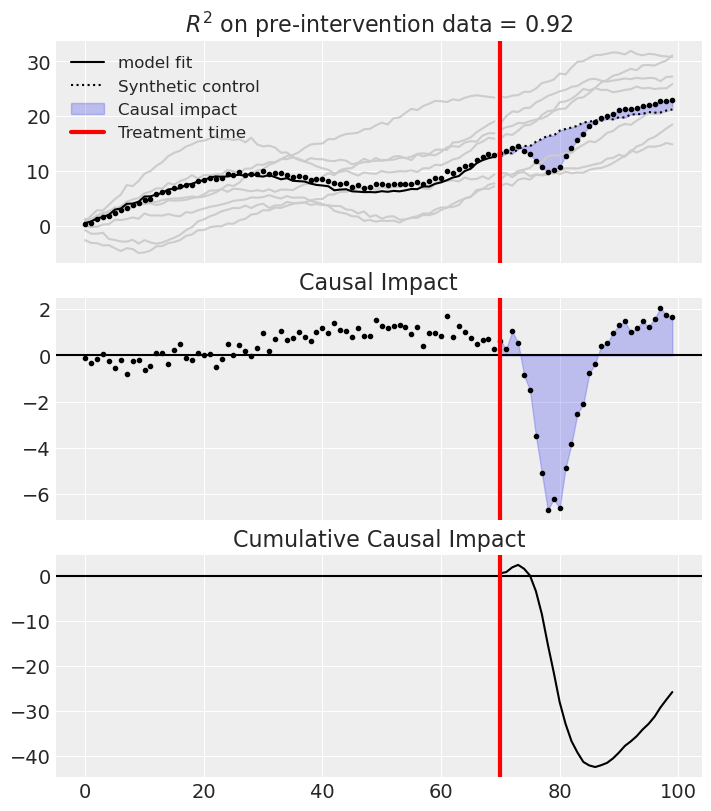
Analyse with WeightedProportion model#
# Note, we do not want an intercept in this model
result = cp.skl_experiments.SyntheticControl(
    df,
    treatment_time,
    formula="actual ~ 0 + a + b + c + d + e + f + g",
    model=cp.skl_models.WeightedProportion(),
)
fig, ax = result.plot(plot_predictors=True)
result.plot_coeffs()
/Users/benjamv/git/CausalPy/causalpy/skl_experiments.py:232: FutureWarning:

Passing `palette` without assigning `hue` is deprecated and will be removed in v0.14.0. Assign the `y` variable to `hue` and set `legend=False` for the same effect.

  sns.barplot(
/Users/benjamv/git/CausalPy/causalpy/skl_experiments.py:232: UserWarning:
The palette list has fewer values (6) than needed (7) and will cycle, which may produce an uninterpretable plot.
  sns.barplot(
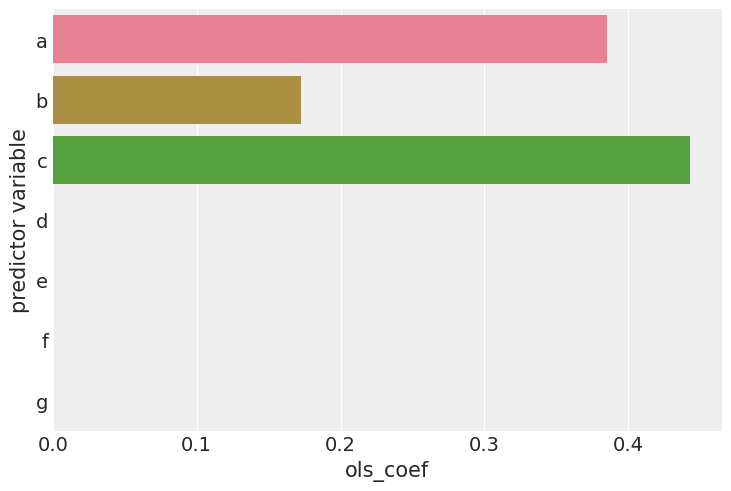
result.summary(round_to=3)
==================================Pre-Post Fit==================================
Formula: actual ~ 0 + a + b + c + d + e + f + g
Model coefficients:
	a		0.385
	b		0.172
	c		0.443
	d		0
	e		5.39e-18
	f		0
	g		0
But we can see that (for this dataset) these estimates are quite bad. So we can lift the “sum to 1” assumption and instead use the LinearRegression model, but still constrain weights to be positive. Equally, you could experiment with the Ridge model (e.g. Ridge(positive=True, alpha=100)).
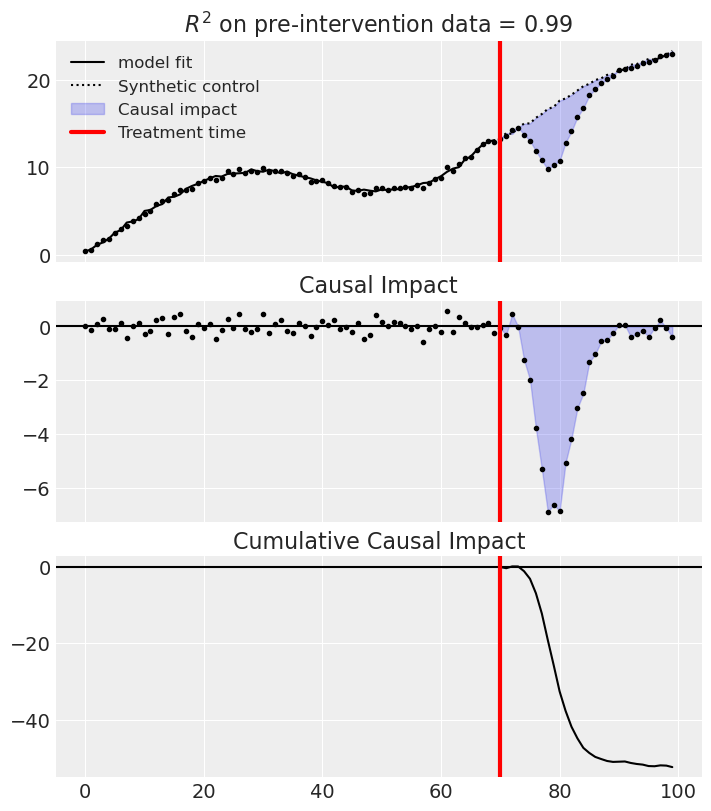
Analyse with the LinearRegression model#
# Note, we do not want an intercept in this model
result = cp.skl_experiments.SyntheticControl(
    df,
    treatment_time,
    formula="actual ~ 0 + a + b + c + d + e + f + g",
    model=LinearRegression(positive=True),
)
fig, ax = result.plot()
result.plot_coeffs()
/Users/benjamv/git/CausalPy/causalpy/skl_experiments.py:232: FutureWarning:

Passing `palette` without assigning `hue` is deprecated and will be removed in v0.14.0. Assign the `y` variable to `hue` and set `legend=False` for the same effect.

  sns.barplot(
/Users/benjamv/git/CausalPy/causalpy/skl_experiments.py:232: UserWarning:
The palette list has fewer values (6) than needed (7) and will cycle, which may produce an uninterpretable plot.
  sns.barplot(
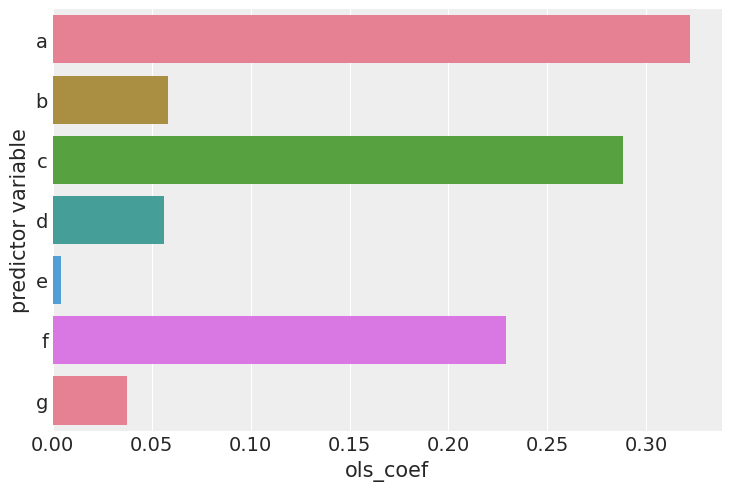
result.summary(round_to=3)
==================================Pre-Post Fit==================================
Formula: actual ~ 0 + a + b + c + d + e + f + g
Model coefficients:
	a		0.322
	b		0.0581
	c		0.288
	d		0.0561
	e		0.00418
	f		0.229
	g		0.0378